Swarmprom
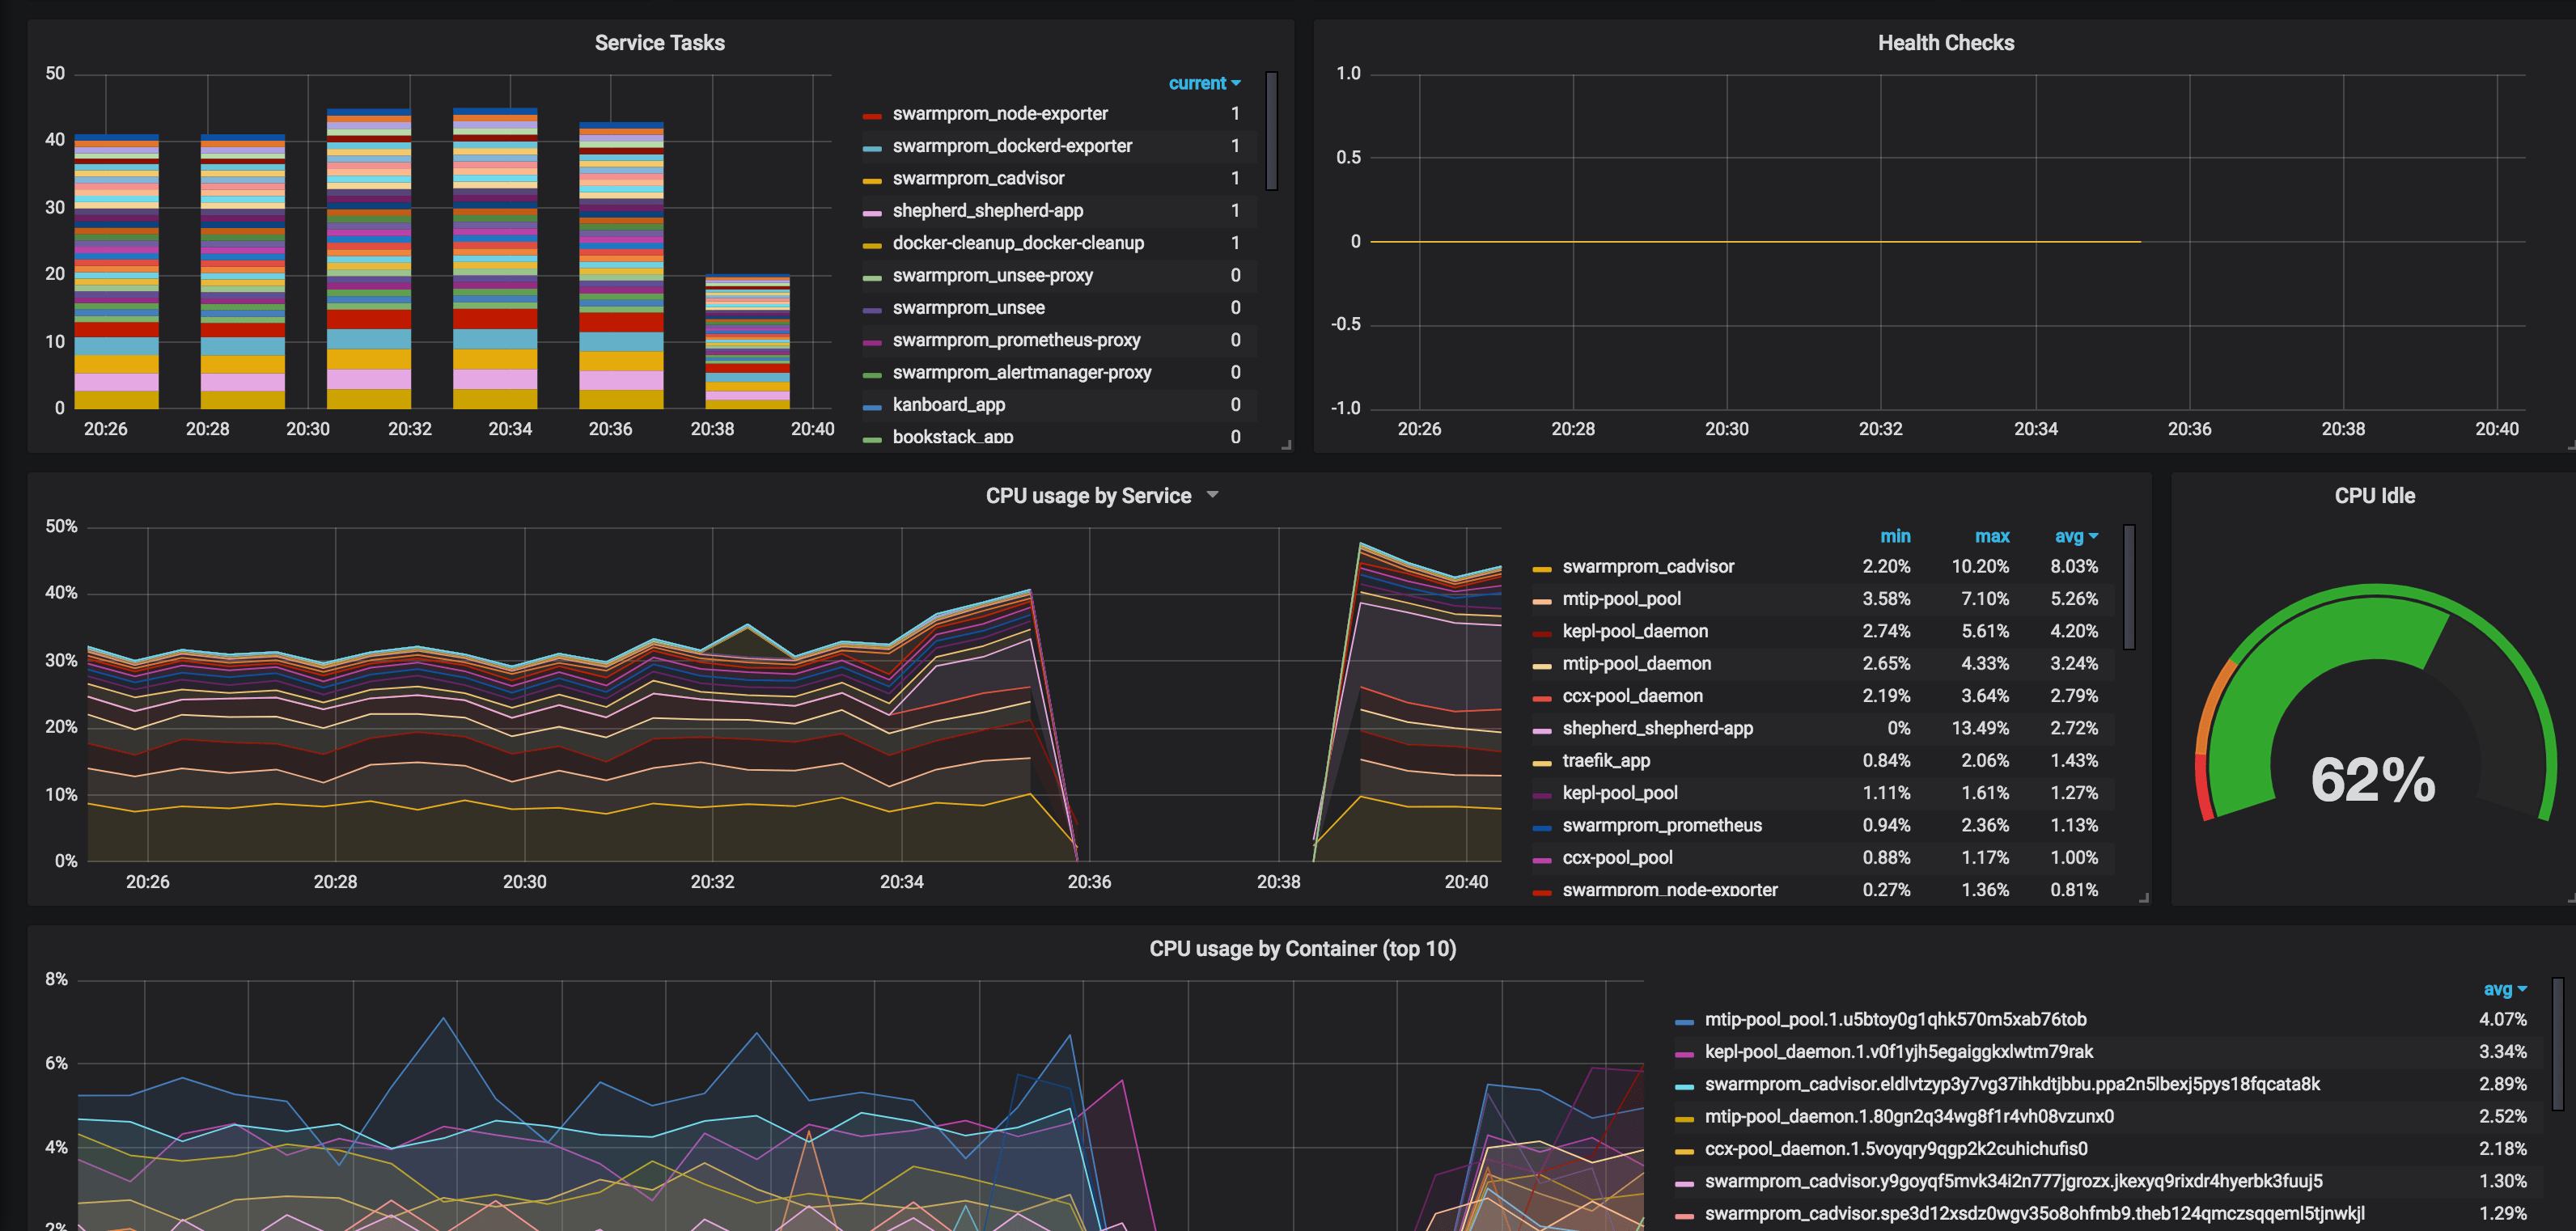
Swarmprom is a starter kit for Docker Swarm monitoring with Prometheus, Grafana, cAdvisor, Node Exporter, Alert Manager and Unsee. And it's damn sexy. See for yourself:
So what do all these components do?
- Prometheus is an open-source systems monitoring and alerting toolkit originally built at SoundCloud.
- Grafana is a tool to make data beautiful.
- cAdvisor cAdvisor (Container Advisor) provides container users an understanding of the resource usage and performance characteristics of their running containers. It is a running daemon that collects, aggregates, processes, and exports information about running containers.
- Node Exporter is a Prometheus exporter for hardware and OS metrics
- Alert Manager Alertmanager handles alerts sent by client applications such as the Prometheus server. It takes care of deduplicating, grouping, and routing them to the correct receiver integrations such as email, Slack, etc.
- Unsee is an alert dashboard for Alert Manager
How does this magic work?
I'd encourage you to spend some time reading https://github.com/stefanprodan/swarmprom. Stefan has included detailed explanations about which elements perform which functions, as well as how to customize your stack. (This is only a starting point, after all)
Swarmprom Requirements
Ingredients
Already deployed:
- Docker swarm cluster with persistent shared storage
- Traefik configured per design
- DNS entry for the hostname you intend to use (or a wildcard), pointed to your keepalived IP
Related:
- Traefik Forward Auth or Authelia to secure your Traefik-exposed services with an additional layer of authentication
Preparation
This is basically a rehash of stefanprodan's instructions to match the way I've configured other recipes.
Setup oauth provider
Grafana includes decent login protections, but from what I can see, Prometheus, AlertManager, and Unsee do no authentication. In order to expose these publicly for your own consumption (my assumption for the rest of this recipe), you'll want to prepare to run oauth_proxy containers in front of each of the 4 web UIs in this recipe.
Setup metrics
Edit (or create, depending on your OS) /etc/docker/daemon.json, and add the following, to enable the experimental export of metrics to Prometheus:
{
  "metrics-addr" : "0.0.0.0:9323",
  "experimental" : true
}
Restart docker with systemctl restart docker
Setup and populate data locations
We'll need several files to bind-mount into our containers, so create directories for them and get the latest copies:
mkdir -p /var/data/swarmprom/dockerd-exporter/
cd /var/data/swarmprom/dockerd-exporter/
wget https://raw.githubusercontent.com/stefanprodan/swarmprom/master/dockerd-exporter/Caddyfile

mkdir -p /var/data/swarmprom/prometheus/rules/
cd /var/data/swarmprom/prometheus/rules/
wget https://raw.githubusercontent.com/stefanprodan/swarmprom/master/prometheus/rules/swarm_task.rules.yml
wget https://raw.githubusercontent.com/stefanprodan/swarmprom/master/prometheus/rules/swarm_node.rules.yml

# Directories for holding runtime data
mkdir /var/data/runtime/swarmprom/grafana/
mkdir /var/data/runtime/swarmprom/alertmanager/
mkdir /var/data/runtime/prometheus

chown nobody:nogroup /var/data/runtime/prometheus
Prepare Grafana
Grafana will make all the data we collect from our swarm beautiful.
Create /var/data/swarmprom/grafana.env, and populate with the following variables
OAUTH2_PROXY_CLIENT_ID=
OAUTH2_PROXY_CLIENT_SECRET=
OAUTH2_PROXY_COOKIE_SECRET=

# Disable basic auth (it conflicts with oauth_proxy)
GF_AUTH_BASIC_ENABLED=false

# Set this to the real-world URL to your grafana install (else you get screwy CSS thanks to oauth_proxy)
GF_SERVER_ROOT_URL=https://grafana.example.com
GF_SERVER_DOMAIN=grafana.example.com

# Set your default admin/pass here
GF_SECURITY_ADMIN_USER=admin
GF_SECURITY_ADMIN_PASSWORD=ilovemybatmanunderpants
Swarmprom Docker Swarm config
Create a docker swarm config file in docker-compose syntax (v3), based on the original swarmprom docker-compose.yml file
Fast-track with premix! 🚀
"Premix" is a git repository which includes necessary docker-compose and env files for all published recipes. This means that you can launch any recipe with just a git pull and a docker stack deploy 👍.
🚀 Update: Premix now includes an ansible playbook, enabling you to deploy an entire stack + recipes, with a single ansible command! (more here)
This example is 274 lines long. Click here to collapse it for better readability
version: "3.3"

networks:
  net:
    driver: overlay
    attachable: true

volumes:
    prometheus: {}
    grafana: {}
    alertmanager: {}

configs:
  dockerd_config:
    file: /var/data/swarmprom/dockerd-exporter/Caddyfile
  node_rules:
    file: /var/data/swarmprom/prometheus/rules/swarm_node.rules.yml
  task_rules:
    file: /var/data/swarmprom/prometheus/rules/swarm_task.rules.yml

services:
  dockerd-exporter:
    image: stefanprodan/caddy
    networks:
      - internal
    environment:
      - DOCKER_GWBRIDGE_IP=172.18.0.1
    configs:
      - source: dockerd_config
        target: /etc/caddy/Caddyfile
    deploy:
      mode: global
      resources:
        limits:
          memory: 128M
        reservations:
          memory: 64M

  cadvisor:
    image: google/cadvisor
    networks:
      - internal
    command: -logtostderr -docker_only
    volumes:
      - /var/run/docker.sock:/var/run/docker.sock:ro
      - /:/rootfs:ro
      - /var/run:/var/run
      - /sys:/sys:ro
      - /var/lib/docker/:/var/lib/docker:ro
    deploy:
      mode: global
      resources:
        limits:
          memory: 128M
        reservations:
          memory: 64M

  grafana:
    image: stefanprodan/swarmprom-grafana:5.3.4
    networks:
      - internal
    env_file: /var/data/config/swarmprom/grafana.env
    environment:
      - GF_USERS_ALLOW_SIGN_UP=false
      - GF_SMTP_ENABLED=${GF_SMTP_ENABLED:-false}
      - GF_SMTP_FROM_ADDRESS=${GF_SMTP_FROM_ADDRESS:-grafana@test.com}
      - GF_SMTP_FROM_NAME=${GF_SMTP_FROM_NAME:-Grafana}
      - GF_SMTP_HOST=${GF_SMTP_HOST:-smtp:25}
      - GF_SMTP_USER=${GF_SMTP_USER}
      - GF_SMTP_PASSWORD=${GF_SMTP_PASSWORD}
    volumes:
      - /var/data/runtime/swarmprom/grafana:/var/lib/grafana
    deploy:
      mode: replicated
      replicas: 1
      placement:
        constraints:
          - node.role == manager
      resources:
        limits:
          memory: 128M
        reservations:
          memory: 64M

  grafana-proxy:
    image: a5huynh/oauth2_proxy
    env_file : /var/data/config/swarmprom/grafana.env
    networks:
      - internal
      - traefik_public
    deploy:
      labels:
        - traefik.frontend.rule=Host:grafana.swarmprom.example.com
        - traefik.docker.network=traefik_public
        - traefik.port=4180
    volumes:
      - /var/data/config/swarmprom/authenticated-emails.txt:/authenticated-emails.txt
    command: |
      -cookie-secure=false
      -upstream=http://grafana:3000
      -redirect-url=https://grafana.swarmprom.example.com
      -http-address=http://0.0.0.0:4180
      -email-domain=example.com
      -provider=github
      -authenticated-emails-file=/authenticated-emails.txt

  alertmanager:
    image: stefanprodan/swarmprom-alertmanager:v0.14.0
    networks:
      - internal
    environment:
      - SLACK_URL=${SLACK_URL:-https://hooks.slack.com/services/TOKEN}
      - SLACK_CHANNEL=${SLACK_CHANNEL:-general}
      - SLACK_USER=${SLACK_USER:-alertmanager}
    command:
      - '--config.file=/etc/alertmanager/alertmanager.yml'
      - '--storage.path=/alertmanager'
    volumes:
      - /var/data/runtime/swarmprom/alertmanager:/alertmanager
    deploy:
      mode: replicated
      replicas: 1
      placement:
        constraints:
          - node.role == manager
      resources:
        limits:
          memory: 128M
        reservations:
          memory: 64M

  alertmanager-proxy:
    image: a5huynh/oauth2_proxy
    env_file : /var/data/config/swarmprom/alertmanager.env
    networks:
      - internal
      - traefik_public
    deploy:
      labels:
        - traefik.frontend.rule=Host:alertmanager.swarmprom.example.com
        - traefik.docker.network=traefik_public
        - traefik.port=4180
    volumes:
      - /var/data/config/swarmprom/authenticated-emails.txt:/authenticated-emails.txt
    command: |
      -cookie-secure=false
      -upstream=http://alertmanager:9093
      -redirect-url=https://alertmanager.swarmprom.example.com
      -http-address=http://0.0.0.0:4180
      -email-domain=example.com
      -provider=github
      -authenticated-emails-file=/authenticated-emails.txt

  unsee:
    image: cloudflare/unsee:v0.8.0
    networks:
      - internal
    environment:
      - "ALERTMANAGER_URIS=default:http://alertmanager:9093"
    deploy:
      mode: replicated
      replicas: 1

  unsee-proxy:
    image: a5huynh/oauth2_proxy
    env_file : /var/data/config/swarmprom/unsee.env
    networks:
      - internal
      - traefik_public
    deploy:
      labels:
        - traefik.frontend.rule=Host:unsee.swarmprom.example.com
        - traefik.docker.network=traefik_public
        - traefik.port=4180
    volumes:
      - /var/data/config/swarmprom/authenticated-emails.txt:/authenticated-emails.txt
    command: |
      -cookie-secure=false
      -upstream=http://unsee:8080
      -redirect-url=https://unsee.swarmprom.example.com
      -http-address=http://0.0.0.0:4180
      -email-domain=example.com
      -provider=github
      -authenticated-emails-file=/authenticated-emails.txt


  node-exporter:
    image: stefanprodan/swarmprom-node-exporter:v0.16.0
    networks:
      - internal
    environment:
      - NODE_ID={{.Node.ID}}
    volumes:
      - /proc:/host/proc:ro
      - /sys:/host/sys:ro
      - /:/rootfs:ro
      - /etc/hostname:/etc/nodename
    command:
      - '--path.sysfs=/host/sys'
      - '--path.procfs=/host/proc'
      - '--collector.textfile.directory=/etc/node-exporter/'
      - '--collector.filesystem.ignored-mount-points=^/(sys|proc|dev|host|etc)($$|/)'
      # no collectors are explicitely enabled here, because the defaults are just fine,
      # see https://github.com/prometheus/node_exporter
      # disable ipvs collector because it barfs the node-exporter logs full with errors on my centos 7 vm's
      - '--no-collector.ipvs'
    deploy:
      mode: global
      resources:
        limits:
          memory: 128M
        reservations:
          memory: 64M

  prometheus:
    image: stefanprodan/swarmprom-prometheus:v2.5.0
    networks:
      - internal
    command:
      - '--config.file=/etc/prometheus/prometheus.yml'
      - '--web.console.libraries=/etc/prometheus/console_libraries'
      - '--web.console.templates=/etc/prometheus/consoles'
      - '--storage.tsdb.path=/prometheus'
      - '--storage.tsdb.retention=24h'
    volumes:
      - /var/data/runtime/swarmprom/prometheus:/prometheus
    configs:
      - source: node_rules
        target: /etc/prometheus/swarm_node.rules.yml
      - source: task_rules
        target: /etc/prometheus/swarm_task.rules.yml
    deploy:
      mode: replicated
      replicas: 1
      placement:
        constraints:
          - node.role == manager
      resources:
        limits:
          memory: 2048M
        reservations:
          memory: 128M

  prometheus-proxy:
    image: a5huynh/oauth2_proxy
    env_file : /var/data/config/swarmprom/prometheus.env
    networks:
      - internal
      - traefik_public
    deploy:
      labels:
        - traefik.frontend.rule=Host:prometheus.swarmprom.example.com
        - traefik.docker.network=traefik_public
        - traefik.port=4180
    volumes:
      - /var/data/config/swarmprom/authenticated-emails.txt:/authenticated-emails.txt
    command: |
      -cookie-secure=false
      -upstream=http://prometheus:9090
      -redirect-url=https://prometheus.swarmprom.example.com
      -http-address=http://0.0.0.0:4180
      -email-domain=example.com
      -provider=github
      -authenticated-emails-file=/authenticated-emails.txt


networks:
  traefik_public:
    external: true
  internal:
    driver: overlay
    ipam:
      config:
        - subnet: 172.16.29.0/24
Note
Setup unique static subnets for every stack you deploy. This avoids IP/gateway conflicts which can otherwise occur when you're creating/removing stacks a lot. See my list here.
Serving
Launch Swarmprom stack
Launch the Swarm stack by running docker stack deploy swarmprom -c <path -to-docker-compose.yml>
Log into your new grafana instance, check out your beautiful graphs. Move onto drooling over Prometheus, AlertManager, and Unsee.
Chef's notes 📓
-
Pay close attention to the
grafana.envconfig. If you encounter errors aboutbasic auth failed, or failed CSS, it's likely due to misconfiguration of one of the grafana environment variables. ↩
Tip your waiter (sponsor) 👏
Did you receive excellent service? Want to compliment the chef? (..and support development of current and future recipes!) Sponsor me on Github / Ko-Fi / Patreon, or see the contribute page for more (free or paid) ways to say thank you! 👏
Employ your chef (engage) 🤝
Is this too much of a geeky PITA? Do you just want results, stat? I do this for a living - I'm a full-time Kubernetes contractor, providing consulting and engineering expertise to businesses needing short-term, short-notice support in the cloud-native space, including AWS/Azure/GKE, Kubernetes, CI/CD and automation.
Learn more about working with me here.
Flirt with waiter (subscribe) 💌
Want to know now when this recipe gets updated, or when future recipes are added? Subscribe to the RSS feed, or leave your email address below, and we'll keep you updated.